REGIONAL HEALTHCARE WORKFORCE DATA DASHBOARD
Collecting, analyzing, and sharing actionable healthcare workforce data
The big picture
The total economic impact of the healthcare industry in the Greater Cincinnati region is $33 billion, which includes direct employment of nearly 140,000 jobs, including both clinical roles and non-clinical roles. Healthcare is our region’s top employment sector and one of the fastest growing, and increasing our region’s healthcare workforce is more imperative now than at any time in the last several decades.
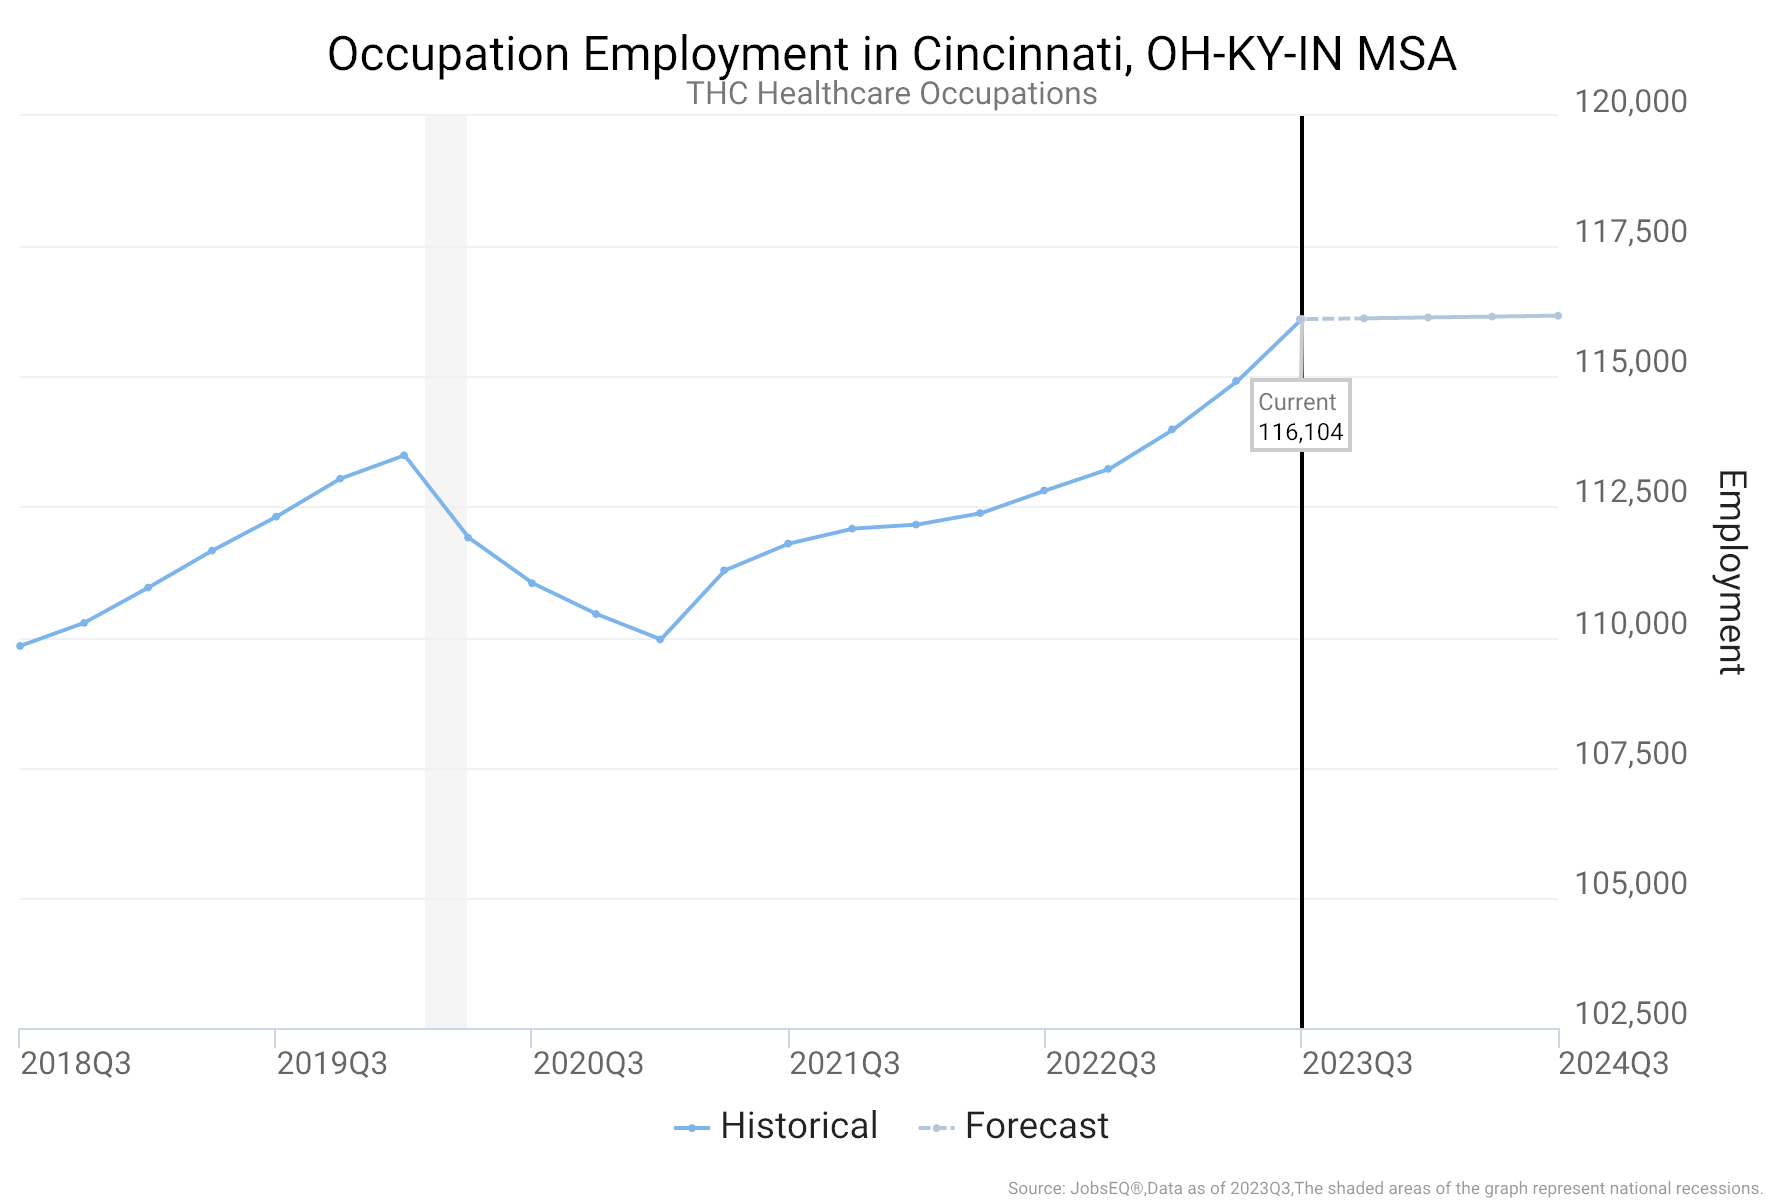
As of 2023, among the 140,000 total healthcare jobs in Greater Cincinnati, more than 116,000 of those employed incumbents are in clinical healthcare roles and this figure is projected to grow another 1.5 percent in just the next two years according to JobsEQ and Chmura Analytics.
Technical Note: For purposes of defining clinical healthcare roles within the labor market, we used JobsEQ to pull market data within the Cincinnati MSA for two major categories within the Standard Occupational Classification (SOC) code system, 29-0000 (Healthcare Practitioners and Technical Occupations) and 31-0000 (Healthcare Support Occupations). For more information on SOC codes, please visit the BLS page to access the full List of SOC Occupations.
Our approach to data
Since 1990, we have been collecting and analyzing healthcare workforce data in the Greater Cincinnati region to help our member healthcare employers make informed workforce decisions. We publish two Employer Workforce Survey reports each year that include current data on the health systems’ workforce vacancies and retirement rates, along with age distributions for key positions. Now, in addition to our own data, we have access to a national labor market analytics tool, JobsEQ, which allows us to research labor market analytics and real-time job posting data.
We are committed to using data to inform and align efforts to meet workforce demands and build a workforce reflective of our community.
A Big Thanks To Interact for Health
Our deepest thanks to Interact for Health for their input and support of this dashboard.
Current workforce demand
In our 2023 semi-annual midyear survey with data effective June 30, 2023, the regional health systems’ overall vacancy rates remain high at 10%, down just .4% compared to our year-end 2022 survey. A healthy vacancy rate for our health systems is about 5%. However, among Greater Cincinnati’s regional hospitals, 21 different job titles of the 60 roles we survey have vacancy rates exceeding 10% as of June 30, 2023. An additional eight job titles report vacancy rates of 7-10%.
This data informs where The Health Collaborative prioritizes our efforts to reduce vacancy rates and fill critical workforce gaps.
Registered nurse vacancy rates
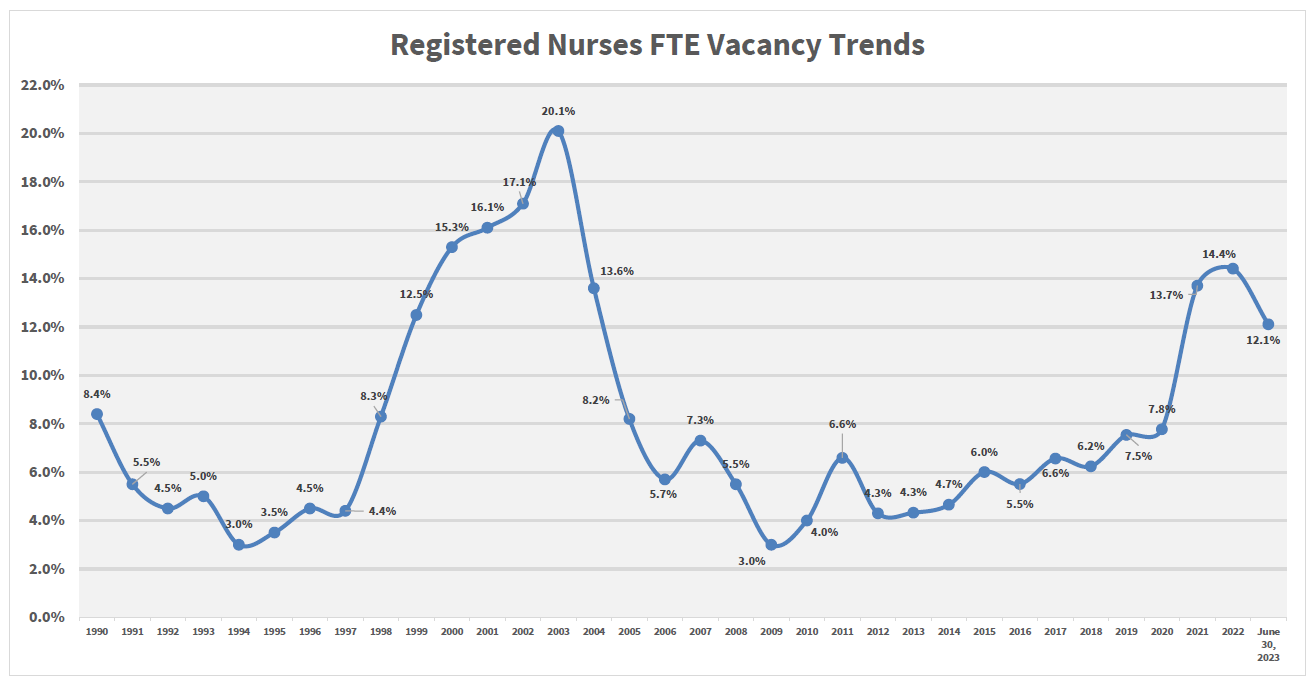
Registered nurse vacancy rates did decline to 12.1% with our 2023 semi-annual midyear survey, down from 14.4 percent at the end of 2022. However, this 12.1% figure still highlights that RNs continue to be in extremely short supply in the Greater Cincinnati region as this is the third highest RN vacancy rate in Greater Cincinnati since 2003. Additionally, as of year-end 2022 the average-time-to-fill for RNs across all health systems in Greater Cincinnati was 85 days, significantly higher than the 2021 figure of 64 days.
The growing deficit in nurses continues to fuel The Health Collaborative’s workforce efforts, including our regional and statewide efforts to reduce the deficit of this critical healthcare position.
Real-time job posting analytics
A second key regional indicator to measure workforce demand is real-time intelligence (RTI) active job postings. While active job postings do not necessarily reflect the total number of job openings available at any one time, they do provide a real-time look into the near-term market trends.
Below is a trend showing active job postings in the last 3 months among Greater Cincinnati healthcare job titles, including a comparison of the same period from a year ago.
Current workforce supply
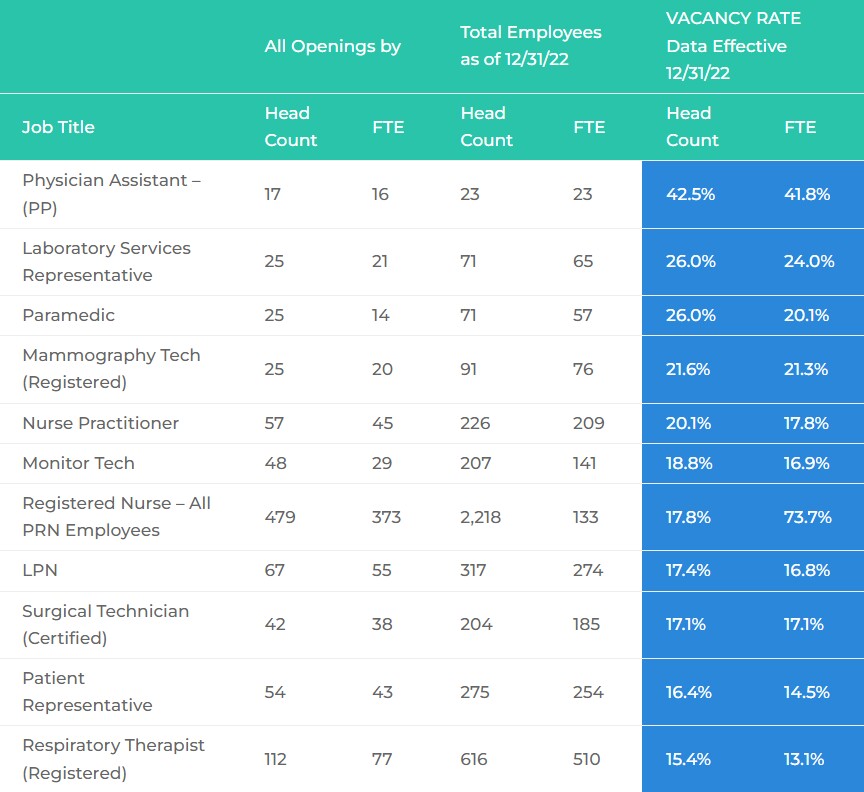
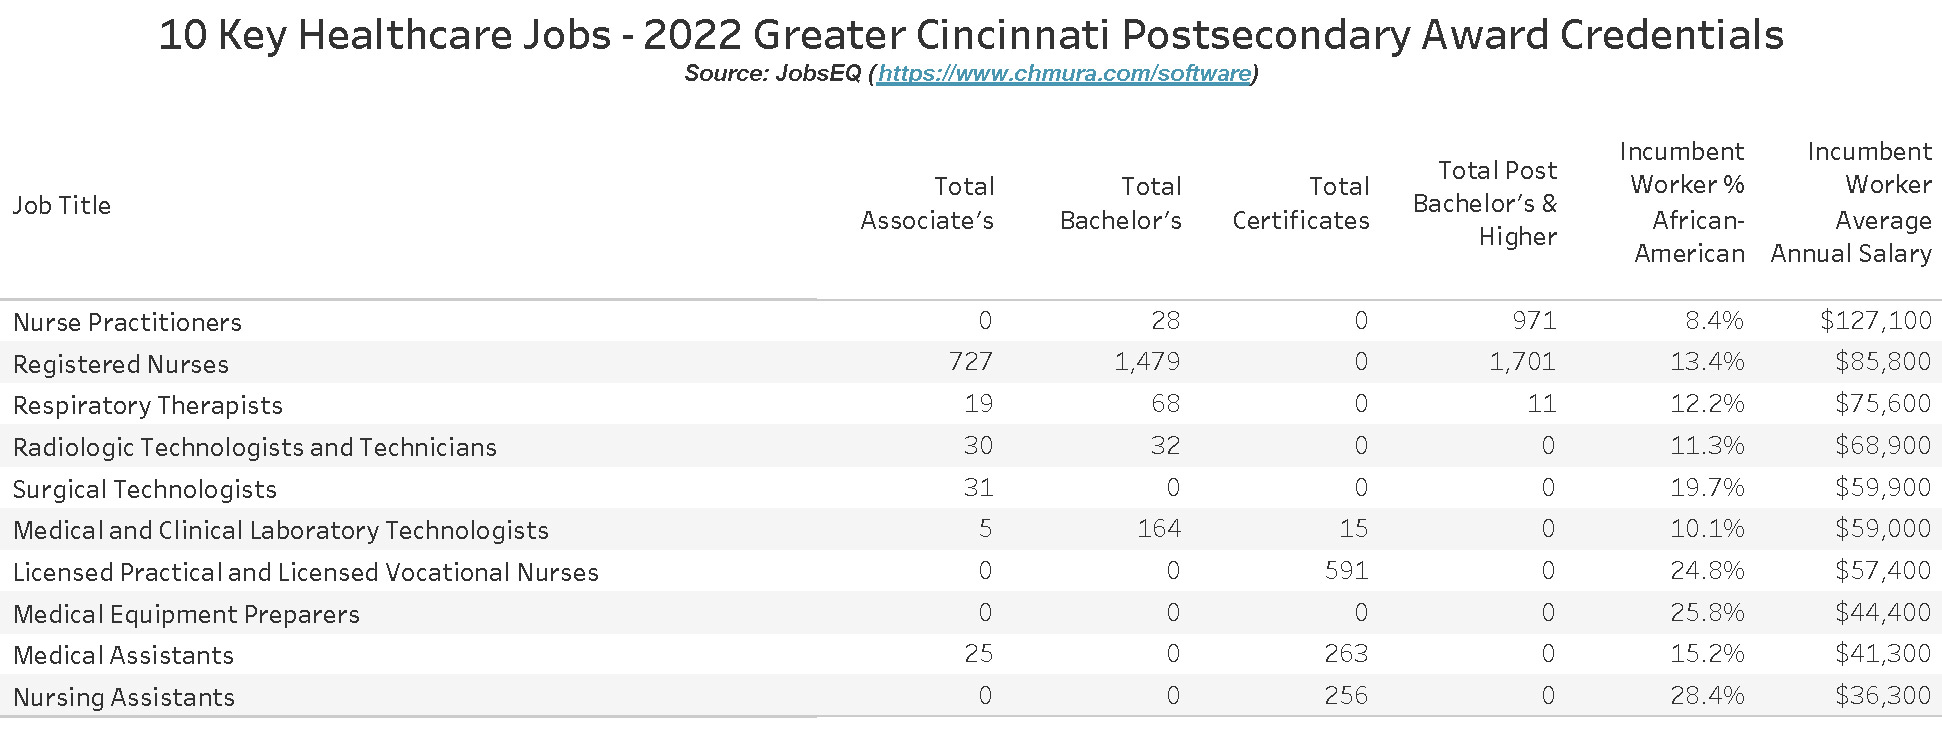
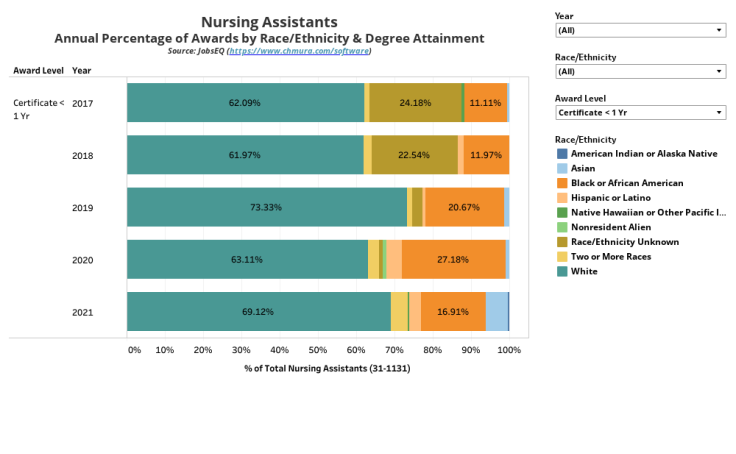
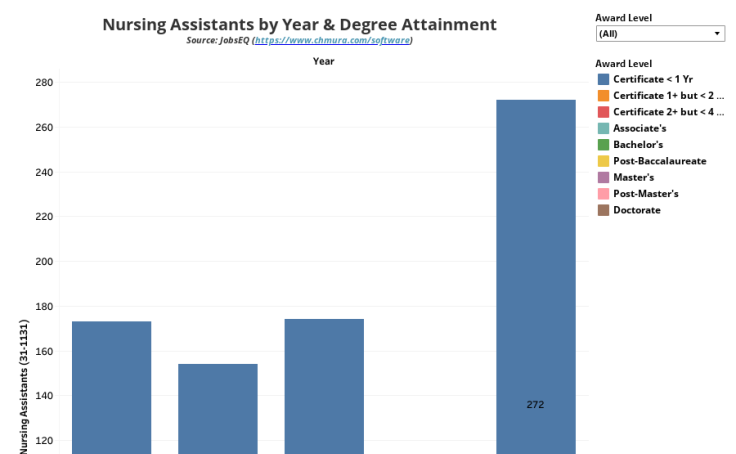
The Health Collaborative focuses our pipeline efforts on critical, in-demand jobs in the Greater Cincinnati region with vacancy rates greater than 10%. This focus ensures our efforts are aligned with our members’ needs and our mission to increase the size, diversity, and preparedness of our region’s healthcare talent pipeline. Below is a summary of the top 10 key jobs we are currently prioritizing.

The following chart identifies key regional job titles with the highest vacancy rates in the Greater Cincinnati region – with each job title having a greater than 7% vacancy rate. In more than 15 years of conducting this survey, our region has never experienced such a wide range of job shortages across all healthcare job categories as we have seen since the beginning of 2021. For comparison purposes, in a typical year with a healthy labor environment in healthcare, most job titles would have vacancy rates of approximately 5%.
| All Openings by | Total Employees as of 12/31/22 | VACANCY RATE Data Effective 12/31/22 | ||||
| Job Title | Head Count | FTE | Head Count | FTE | Head Count | FTE |
| Job Title | Head Count | FTE | Head Count | FTE | Head Count | FTE |
| Paramedic | 34 | 21.8 | 76 | 59.0 | 30.9% | 27.0% |
| Laboratory Services Representative | 17 | 15.0 | 50 | 47.2 | 25.4% | 24.1% |
| Surgical Assistant | 22 | 19.4 | 66 | 107.5 | 25.0% | 15.3% |
| Environmental Services Worker (Entry) | 112 | 106.1 | 432 | 415.9 | 20.6% | 20.3% |
| Patient Transporter | 63 | 55.4 | 243 | 199.3 | 20.6% | 21.7% |
| Patient Care Technician/Nurse Assistant - Total Employees | 497 | 342.7 | 1,965 | 1,275.3 | 20.2% | 21.2% |
| Phlebotomist | 92 | 79.3 | 368 | 316.2 | 20.0% | 20.0% |
| Monitor Tech | 41 | 27.1 | 167 | 119.2 | 19.7% | 18.5% |
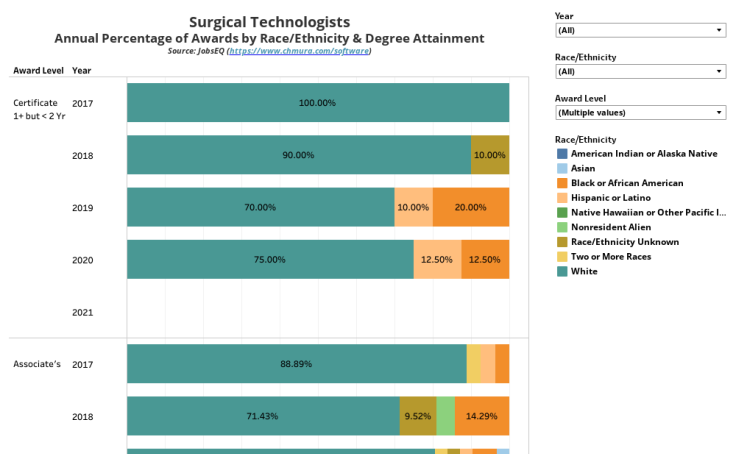
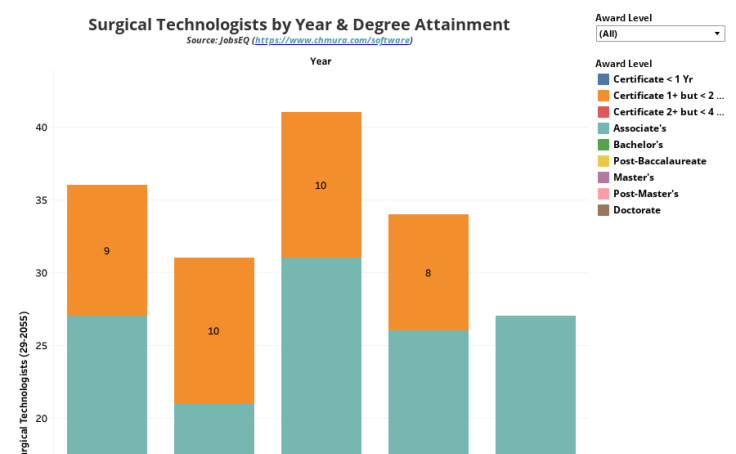
| Surgical Technician (Certified) | 40 | 35.6 | 179 | 162.8 | 18.3% | 18.0% |
| Radiology Tech (Registered) | 76 | 63.2 | 346 | 299.1 | 18.0% | 17.4% |
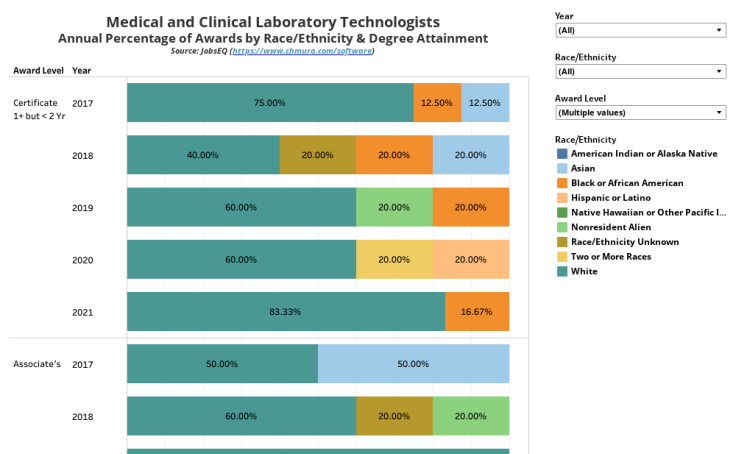
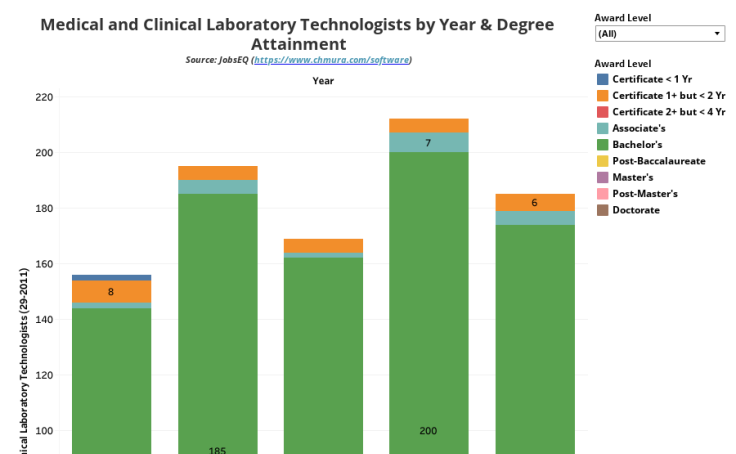
| Medical Technologist I | 32 | 30.3 | 184 | 152.8 | 14.8% | 16.5% |
| LPN | 42 | 36.7 | 250 | 208.4 | 14.4% | 15.0% |
| Pharmacy Technician | 73 | 62.5 | 438 | 397.0 | 14.3% | 13.6% |
| Medical Assistant (Certified and Non-Certified Combined)- (PP) | 88 | 78.1 | 553 | 521.8 | 13.7% | 13.0% |
| Central Supply Tech/Sterilization Tech | 49 | 45.4 | 308 | 294.4 | 13.7% | 13.3% |
| Admitting Clerk | 96 | 74.4 | 629 | 531.1 | 13.2% | 12.3% |
| Nurse Practitioner | 14 | 13.5 | 92 | 87.8 | 13.2% | 13.3% |
| Registered Nurse (Staff) - Total RN Employees | 1,371 | 1,117.1 | 9,886 | 8,108.5 | 12.2% | 12.1% |
| Registered Nurse - (PP) | 52 | 26.3 | 389 | 345.9 | 11.8% | 7.1% |
| Echocardiograph Technician (Registered) | 12 | 11.6 | 103 | 95.6 | 10.4% | 10.8% |
| Medical Assistant (Certified & Non-Cert Combined) | 107 | 94.0 | 968 | 893.4 | 10.0% | 9.5% |
| Social Worker (MSW) | 65 | 52.4 | 599 | 519.6 | 9.8% | 9.2% |
| Patient Representative | 26 | 25.2 | 255 | 241.9 | 9.3% | 9.4% |
| Ultrasonographer (Registered) | 21 | 17.4 | 209 | 177.3 | 9.1% | 8.9% |
| Pharmacist (Registered) | 53 | 44.2 | 534 | 488.6 | 9.0% | 8.3% |
| Respiratory Therapist (Registered) | 60 | 43.4 | 630 | 518.8 | 8.7% | 7.7% |
| CAT Scan (CT) Technician (Registered) | 22 | 20.6 | 241 | 215.7 | 8.4% | 8.7% |
| Medical Lab Tech (MLT) | 28 | 26.1 | 319 | 292.0 | 8.1% | 8.2% |
| Patient Financial Services Representative | 35 | 35.0 | 422 | 418.8 | 7.7% | 7.7% |
Workforce Survey December 2022
Compensation and benefit surveys for our members
The Health Collaborative is the only source that provides clinical compensation data specifically for Greater Cincinnati. This data enables our members to make the proper compensation, benefits, and recruiting decisions, while also maintaining a robust total rewards program. Members interested in learning how we can help your compensation and benefits teams, please reach out to Jason Bubenhofer for more information.
Interested in knowing when new workforce data is released?
Complete this form
